Co-authored by Alex Verkhivker, Graduate Student at the UCLA Anderson School of Management
It’s rare to find academic economists in the Ivory Tower creating new technologies that generate waves of interest jointly from policymakers, Wall Street and Silicon Valley. Roberto Rigobon and Alberto Cavallo, two professors at the MIT Sloan School of Management, make an exception. Since 2006, the tandem academic team have been working diligently on “The Billion Prices Project“ (BPP), an initiative that gathers price data by scraping information from online retailers around the globe. The high-frequency price data from the internet is then aggregated to measure inflation on a daily basis, helping government officials, economists and investors learn macroeconomic trends in real time.
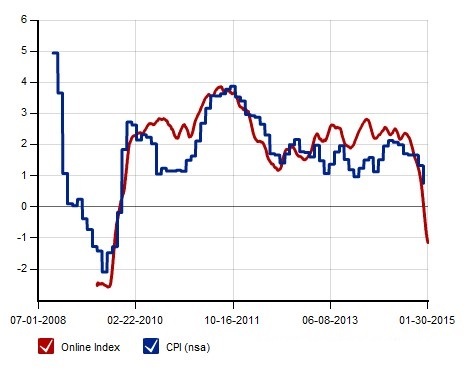
Using online prices, the BPP daily inflation indices cover more than 70 countries and use daily price fluctuations of over five million items sold in over 300 online retailers. Since inception, the BPP U.S. inflation index has moved reasonably closely with the U.S. Consumer Price Index (CPI), an inflation index published by the Bureau of Labor Statistics which tracks monthly data on the prices paid by urban consumers for a representative basket of goods. The CPI’s annual percentage change is used as one of the canonical measures of inflation alongside the PCE published by the Bureau of Economic Analysis that often runs 0.5% lower than annual change in CPI and is often used by the Fed in its inflation forecasting. As one of the most widely tracked macroeconomic indicators, the CPI is published monthly at a lag and doesn’t give policymakers and economists the same timeliness associated that real-time price indices like the BPP series can provide.
PriceStats (Billion Prices Project) Annual Inflation Versus CPI

Source: MIT Billion Prices Project, PriceStats, State Street, Bureau of Labor Statistics
One key observation made by MIT professor and BPP co-founder Alberto Cavallo in a working paper using Billion Prices Project inflation data is that the menu costs of adjusting online prices versus offline prices are lower, making them easier for online retailers like Amazon.com to adjust prices that are “less sticky” compared to the prices at book-and-mortar retailers such as Barnes & Noble. As a result, macroeconomic shocks to prices resulting from changes in aggregate demand can appear earlier in the Billion Prices Project indices before they pass-through to offline inflation indices like the CPI. That being said, online inflation indices have some weaknesses as online prices are unable to capture changes in the price of services, one component of CPI.
Premise, a start-up data company based in San Francisco, takes a different approach to measuring inflation using new technology. They focus on aggregating and collecting price data from iPhone snapshots of price tags taken by paid individuals that are scattered across a wide variety of countries (some of which have underdeveloped national statistics).
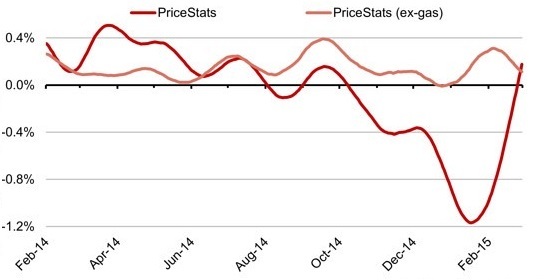
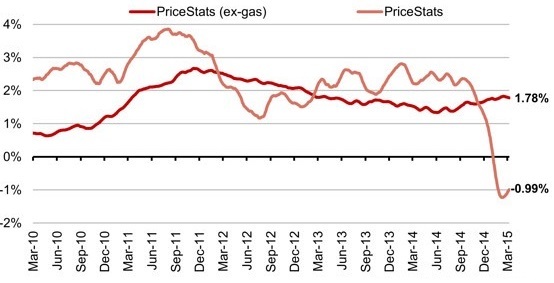
Indeed, research on real-time data has become a popular new tool for economic forecasters trying to predict future trends in inflation and the consequences for monetary policy given inflation is one of the two components in the Fed’s dual mandate of price stability and full-employment. For instance, Josh Zumbrun from The Wall Street Journal has found that the latest data from the BPP indicates that inflation may finally be experiencing an uptick after falling in tandem with the price of oil in the fourth quarter of 2014. This uptick in inflation measured by the BPP could have serious implications for monetary policy as this may signal that the core PCE inflation rate, which remained steady at 1.3% as of January, may now be on its way toward reaching the Fed’s 2% target, potentially adding to confidence that the Fed will begin raising interest rates sometime this year.
PriceStats (BPP) Core Inflation (ex-gas) and PriceStats Headline Inflation (month-over-month)

PriceStats (BPP) Core Inflation (ex-gas) and PriceStats Headline Inflation (year-over-year)

Source: PriceStats, The Wall Street Journal
Following this same kind of innovation of using online data to measure macroeconomic trends, one of the co-authors of this article runs a start-up (Real Time Macroeconomics, LLC) that seeks to monitor the labor market in real-time using online data much like how the MIT Billion Prices Project uses online data to measure inflation. Real Time Macroeconomics seeks to create real-time LaborStats indicators for job openings, layoff announcements, wage growth, and employment all using online data from a variety of unconventional sources. These indicators are built to closely follow the respective Bureau of Labor Statistics indices with the added flexibility of near real-time data delivery and more granularity.
Commenting on the present state of government statistics provided by the BLS, former Obama Council of Economic Advisors Chairman Alan Krueger has previously said that “There’s still a Cold War element to our statistics”, in that the methods and indices created are by and large unchanged since the beginning of the post-war period. The question of whether Big Data “can replace the federal statistical system” was a theme at a panel at the American Enterprise Institute hosted this past week by AEI scholars Michael Strain and Stan Veuger, titled “The Federal Statistical System In A Big Data World”. Robert Groves, Provost of Georgetown University and former director of the Census Bureau outlined the pros and cons of both online “organic” data and offline survey data, suggesting that “we have to put these two data sources together.”
Erica Groshen, the commissioner of the Bureau of Labor Statistics (BLS), praised the MIT Billion Prices Project as being able to meet the demands of investors and companies engaged in international trade that monitor inflation on a daily basis, but countered that BPP “by its very nature, can’t price the same representative bundle on a daily basis” and also argued that the BPP “depends on the existence of CPI”, as BLS research producing CPI bundle weights are the same weights used in calculating the BPP U.S. inflation index. She concluded that the BPP and CPI are “complementary” saying that Big Data can certainly help to “enhance efficiencies”, citing a few examples of how the BLS is beginning to engage in using Big Data.
Alberto Cavallo, MIT Sloan School of Management professor and co-founder of the BPP also spoke about how Big Data allows for the “ability to measure things we could not measure before” citing how data collected from new sources like satellite imagery can help measure economic trends. He agreed with commissioner Groshen in saying that the BLS and BPP data were “complementary”.
The consensus from the panel and other experts on both official BLS data and on novel Big Data economic datasets are that the two types of data should be viewed as complementary as both continue to evolve in the 21st century. We are certainly excited to see new and interesting ways official government statistics and Big Data will complement each other going forward in the realm of economics.
It’s rare to find academic economists in the Ivory Tower creating new technologies that generate waves of interest jointly from policymakers, Wall Street and Silicon Valley. Roberto Rigobon and Alberto Cavallo, two professors at the MIT Sloan School of Management, make an exception. Since 2006, the tandem academic team have been working diligently on “The Billion Prices Project“ (BPP), an initiative that gathers price data by scraping information from online retailers around the globe. The high-frequency price data from the internet is then aggregated to measure inflation on a daily basis, helping government officials, economists and investors learn macroeconomic trends in real time.
Using online prices, the BPP daily inflation indices cover more than 70 countries and use daily price fluctuations of over five million items sold in over 300 online retailers. Since inception, the BPP U.S. inflation index has moved reasonably closely with the U.S. Consumer Price Index (CPI), an inflation index published by the Bureau of Labor Statistics which tracks monthly data on the prices paid by urban consumers for a representative basket of goods. The CPI’s annual percentage change is used as one of the canonical measures of inflation alongside the PCE published by the Bureau of Economic Analysis that often runs 0.5% lower than annual change in CPI and is often used by the Fed in its inflation forecasting. As one of the most widely tracked macroeconomic indicators, the CPI is published monthly at a lag and doesn’t give policymakers and economists the same timeliness associated that real-time price indices like the BPP series can provide.
PriceStats (Billion Prices Project) Annual Inflation Versus CPI

Source: MIT Billion Prices Project, PriceStats, State Street, Bureau of Labor Statistics
One key observation made by MIT professor and BPP co-founder Alberto Cavallo in a working paper using Billion Prices Project inflation data is that the menu costs of adjusting online prices versus offline prices are lower, making them easier for online retailers like Amazon.com to adjust prices that are “less sticky” compared to the prices at book-and-mortar retailers such as Barnes & Noble. As a result, macroeconomic shocks to prices resulting from changes in aggregate demand can appear earlier in the Billion Prices Project indices before they pass-through to offline inflation indices like the CPI. That being said, online inflation indices have some weaknesses as online prices are unable to capture changes in the price of services, one component of CPI.
Premise, a start-up data company based in San Francisco, takes a different approach to measuring inflation using new technology. They focus on aggregating and collecting price data from iPhone snapshots of price tags taken by paid individuals that are scattered across a wide variety of countries (some of which have underdeveloped national statistics).
Indeed, research on real-time data has become a popular new tool for economic forecasters trying to predict future trends in inflation and the consequences for monetary policy given inflation is one of the two components in the Fed’s dual mandate of price stability and full-employment. For instance, Josh Zumbrun from The Wall Street Journal has found that the latest data from the BPP indicates that inflation may finally be experiencing an uptick after falling in tandem with the price of oil in the fourth quarter of 2014. This uptick in inflation measured by the BPP could have serious implications for monetary policy as this may signal that the core PCE inflation rate, which remained steady at 1.3% as of January, may now be on its way toward reaching the Fed’s 2% target, potentially adding to confidence that the Fed will begin raising interest rates sometime this year.
PriceStats (BPP) Core Inflation (ex-gas) and PriceStats Headline Inflation (month-over-month)

PriceStats (BPP) Core Inflation (ex-gas) and PriceStats Headline Inflation (year-over-year)

Source: PriceStats, The Wall Street Journal
Following this same kind of innovation of using online data to measure macroeconomic trends, one of the co-authors of this article runs a start-up (Real Time Macroeconomics, LLC) that seeks to monitor the labor market in real-time using online data much like how the MIT Billion Prices Project uses online data to measure inflation. Real Time Macroeconomics seeks to create real-time LaborStats indicators for job openings, layoff announcements, wage growth, and employment all using online data from a variety of unconventional sources. These indicators are built to closely follow the respective Bureau of Labor Statistics indices with the added flexibility of near real-time data delivery and more granularity.
Commenting on the present state of government statistics provided by the BLS, former Obama Council of Economic Advisors Chairman Alan Krueger has previously said that “There’s still a Cold War element to our statistics”, in that the methods and indices created are by and large unchanged since the beginning of the post-war period. The question of whether Big Data “can replace the federal statistical system” was a theme at a panel at the American Enterprise Institute hosted this past week by AEI scholars Michael Strain and Stan Veuger, titled “The Federal Statistical System In A Big Data World”. Robert Groves, Provost of Georgetown University and former director of the Census Bureau outlined the pros and cons of both online “organic” data and offline survey data, suggesting that “we have to put these two data sources together.”
Erica Groshen, the commissioner of the Bureau of Labor Statistics (BLS), praised the MIT Billion Prices Project as being able to meet the demands of investors and companies engaged in international trade that monitor inflation on a daily basis, but countered that BPP “by its very nature, can’t price the same representative bundle on a daily basis” and also argued that the BPP “depends on the existence of CPI”, as BLS research producing CPI bundle weights are the same weights used in calculating the BPP U.S. inflation index. She concluded that the BPP and CPI are “complementary” saying that Big Data can certainly help to “enhance efficiencies”, citing a few examples of how the BLS is beginning to engage in using Big Data.
Alberto Cavallo, MIT Sloan School of Management professor and co-founder of the BPP also spoke about how Big Data allows for the “ability to measure things we could not measure before” citing how data collected from new sources like satellite imagery can help measure economic trends. He agreed with commissioner Groshen in saying that the BLS and BPP data were “complementary”.
The consensus from the panel and other experts on both official BLS data and on novel Big Data economic datasets are that the two types of data should be viewed as complementary as both continue to evolve in the 21st century. We are certainly excited to see new and interesting ways official government statistics and Big Data will complement each other going forward in the realm of economics.

Thanks...
ReplyDelete3D Prototype Printing Services