From Wikipedia, the free encyclopedia
(Redirected from Systems dynamics)

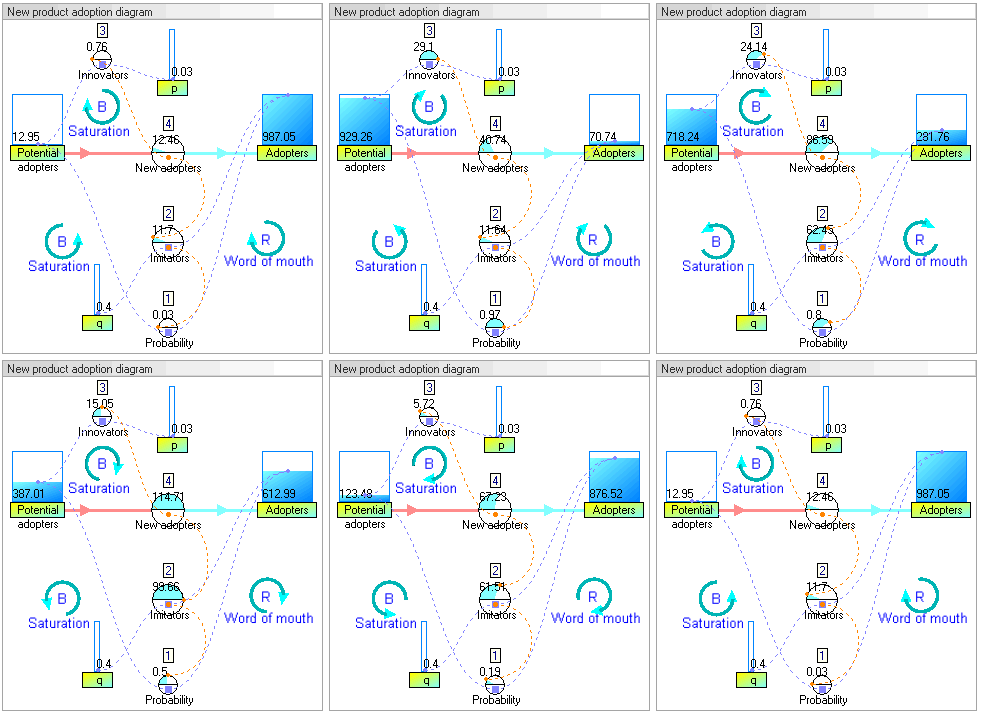
Dynamic stock and flow diagram of model New product adoption (model from article by John Sterman 2001)
Contents[hide] |
[edit] Overview
System Dynamics (SD) is a methodology and mathematical modeling technique for framing, understanding, and discussing complex issues and problems. Originally developed in the 1950s to help corporate managers improve their understanding of industrial processes, system dynamics is currently being used throughout the public and private sector for policy analysis and design.[2]Convenient GUI system dynamics software developed into user friendly versions by the 1990s and have been applied to diverse systems. SD models solve the problem of simultaneity (mutual causation) by updating all variables in small time increments with positive and negative feedbacks and time delays structuring the interactions and control. The best known SD model is probably the 1972 The Limits to Growth. This model forecast that exponential growth would lead to economic collapse during the 21st century under a wide variety of growth scenarios.
System Dynamics is an aspect of systems theory as a method for understanding the dynamic behavior of complex systems. The basis of the method is the recognition that the structure of any system — the many circular, interlocking, sometimes time-delayed relationships among its components — is often just as important in determining its behavior as the individual components themselves. Examples are chaos theory and social dynamics. It is also claimed that because there are often properties-of-the-whole which cannot be found among the properties-of-the-elements, in some cases the behavior of the whole cannot be explained in terms of the behavior of the parts.
[edit] History
System dynamics was created during the mid-1950s[3] by Professor Jay Forrester of the Massachusetts Institute of Technology. In 1956, Forrester accepted a professorship in the newly-formed MIT Sloan School of Management. His initial goal was to determine how his background in science and engineering could be brought to bear, in some useful way, on the core issues that determine the success or failure of corporations. Forrester's insights into the common foundations that underlie engineering, which led to the creation of system dynamics, were triggered, to a large degree, by his involvement with managers at General Electric (GE) during the mid-1950s. At that time, the managers at GE were perplexed because employment at their appliance plants in Kentucky exhibited a significant three-year cycle. The business cycle was judged to be an insufficient explanation for the employment instability. From hand simulations (or calculations) of the stock-flow-feedback structure of the GE plants, which included the existing corporate decision-making structure for hiring and layoffs, Forrester was able to show how the instability in GE employment was due to the internal structure of the firm and not to an external force such as the business cycle. These hand simulations were the beginning of the field of system dynamics.[2]During the late 1950s and early 1960s, Forrester and a team of graduate students moved the emerging field of system dynamics from the hand-simulation stage to the formal computer modeling stage. Richard Bennett created the first system dynamics computer modeling language called SIMPLE (Simulation of Industrial Management Problems with Lots of Equations) in the spring of 1958. In 1959, Phyllis Fox and Alexander Pugh wrote the first version of DYNAMO (DYNAmic MOdels), an improved version of SIMPLE, and the system dynamics language became the industry standard for over thirty years. Forrester published the first, and still classic, book in the field titled Industrial Dynamics in 1961.[2]
From the late 1950s to the late 1960s, system dynamics was applied almost exclusively to corporate/managerial problems. In 1968, however, an unexpected occurrence caused the field to broaden beyond corporate modeling. John Collins, the former mayor of Boston, was appointed a visiting professor of Urban Affairs at MIT. The result of the Collins-Forrester collaboration was a book titled Urban Dynamics. The Urban Dynamics model presented in the book was the first major non-corporate application of system dynamics.[2]
The second major noncorporate application of system dynamics came shortly after the first. In 1970, Jay Forrester was invited by the Club of Rome to a meeting in Bern, Switzerland. The Club of Rome is an organization devoted to solving what its members describe as the "predicament of mankind"—that is, the global crisis that may appear sometime in the future, due to the demands being placed on the Earth's carrying capacity (its sources of renewable and nonrenewable resources and its sinks for the disposal of pollutants) by the world's exponentially growing population. At the Bern meeting, Forrester was asked if system dynamics could be used to address the predicament of mankind. His answer, of course, was that it could. On the plane back from the Bern meeting, Forrester created the first draft of a system dynamics model of the world's socioeconomic system. He called this model WORLD1. Upon his return to the United States, Forrester refined WORLD1 in preparation for a visit to MIT by members of the Club of Rome. Forrester called the refined version of the model WORLD2. Forrester published WORLD2 in a book titled World Dynamics.[2]
[edit] Topics in systems dynamics
The elements of system dynamics diagrams are feedback, accumulation of flows into stocks and time delays.As an illustration of the use of system dynamics, imagine an organisation that plans to introduce an innovative new durable consumer product. The organisation needs to understand the possible market dynamics in order to design marketing and production plans.
[edit] Causal loop diagrams
Main article: Causal loop diagram
In the System Dynamics methodology, a problem or a system (e.g., ecosystem, political system or mechanical system) is first represented as a causal loop diagram.[4] A causal loop diagram is a simple map of a system with all its constituent components and their interactions. By capturing interactions and consequently the feedback loops (see figure below), a causal loop diagram reveals the structure of a system. By understanding the structure of a system, it becomes possible to ascertain a system’s behavior over a certain time period.[5]The causal loop diagram of the new product introduction may look as follows:
There are two feedback loops in this diagram. The positive reinforcement (labeled R) loop on the right indicates that the more people have already adopted the new product, the stronger the word-of-mouth impact. There will be more references to the product, more demonstrations, and more reviews. This positive feedback should generate sales that continue to grow.
The second feedback loop on the left is negative reinforcement (or "balancing" and hence labeled B). Clearly growth can not continue forever, because as more and more people adopt, there remain fewer and fewer potential adopters.
Both feedback loops act simultaneously, but at different times they may have different strengths. Thus one would expect growing sales in the initial years, and then declining sales in the later years.
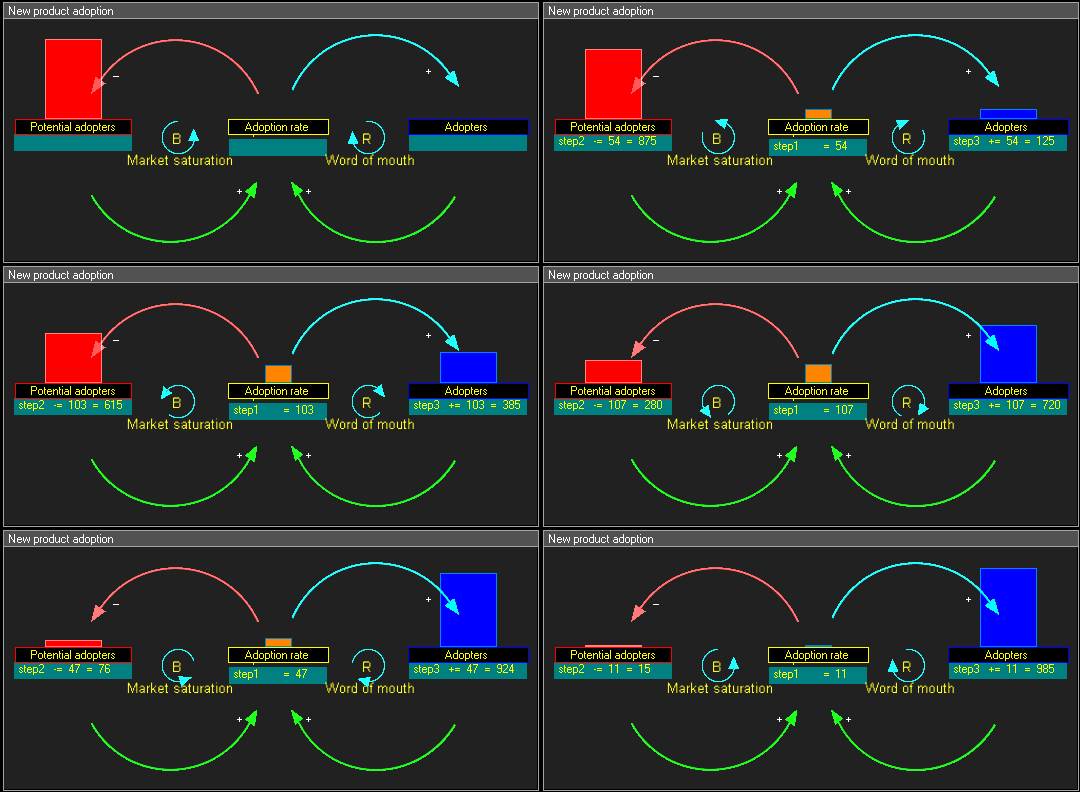
In this dynamic causal loop diagram :
- step1 : (+) green arrows show that Adoption rate is function of Potential Adopters and Adopters
- step2 : (-) red arrow shows that Potential adopters decreases by Adoption rate
- step3 : (+) blue arrow shows that Adopters increases by Adoption rate
[edit] Stock and flow diagrams
Main article: Stock and flow
Causal loop diagrams aid in visualizing a system’s structure and behavior, and analyzing the system qualitatively. To perform a more detailed quantitative analysis, a causal loop diagram is transformed to a stock and flow diagram. A Stock and flow model helps in studying and analyzing the system in a quantitative way, such models are usually built and simulated using computer software.A stock is the term for any entity that accumulates or depletes over time. A flow is the rate of change in a stock.
In our example, there are two stocks: Potential adopters and Adopters. There is one flow: New adopters. For every new adopter, the stock of potential adopters declines by one, and the stock of adopters increases by one.
[edit] Equations
The real power of system dynamics is utilised through simulation. Although it is possible to perform the modeling in a spreadsheet, there are a variety of software packages that have been optimised for this.The steps involved in a simulation are:
- Define the problem boundary
- Identify the most important stocks and flows that change these stock levels
- Identify sources of information that impact the flows
- Identify the main feedback loops
- Draw a causal loop diagram that links the stocks, flows and sources of information
- Write the equations that determine the flows
- Estimate the parameters and initial conditions. These can be estimated using statistical methods, expert opinion, market research data or other relevant sources of information.[6]
- Simulate the model and analyse results.
[edit] Equations in discrete time
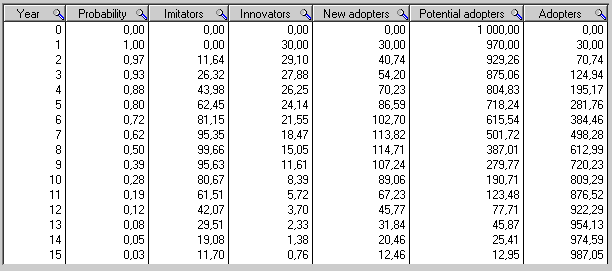
List of all the equations in discrete time, in their order of execution in each year, for years 1 to 15 :[edit] Dynamic simulation results
The dynamic simulation results show that the behaviour of the system would be to have growth in adopters that follows a classical s-curve shape.The increase in adopters is very slow initially, then exponential growth for a period, followed ultimately by saturation.
[edit] Equations in continuous time
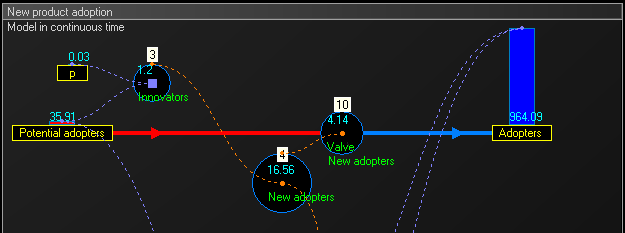
To get intermediate values and better accuracy, the model can run in continuous time : we multiply the number of units of time and we proportionally divide values that change stock levels. In this example we multiply the 15 years by 4 to obtain 60 trimesters, and we divide the value of the flow by 4.Dividing the value is the simplest with the Euler method, but other methods could be imployed instad, such as Runge–Kutta methods.
List of the equations in continuous time for trimesters = 1 to 60 :
- They are the same equations as in the section Equation in discrete time above, except equations 4.1 and 4.2 replaced by following :
- In the below stock and flow diagram, the intermediate flow 'Valve New adopters' calculates the equation :
[edit] Application
System dynamics has found application in a wide range of areas, for example population, ecological and economic systems, which usually interact strongly with each other.System dynamics have various "back of the envelope" management applications. They are a potent tool to:
- Teach system thinking reflexes to persons being coached
- Analyze and compare assumptions and mental models about the way things work
- Gain qualitative insight into the workings of a system or the consequences of a decision
- Recognize archetypes of dysfunctional systems in everyday practice
System dynamics has been used to investigate resource dependencies, and resulting problems, in product development.[8][9]
[edit] Example

Causal loop diagram of a model examining the growth or decline of a life insurance company.[10]
[edit] Example of piston motion
- 1.Objective : study of a crank-connecting rod system.
- 2.System dynamic modeling : the system is now modelled, according to a stock and flow system dynamic logic.
- 3.Simulation : the behavior of the crank-connecting rod dynamic system can then be simulated.

3D Procedural animation of the crank-connecting rod system modeled in 2
[edit] See also
|
[edit] References
- ^ MIT System Dynamics in Education Project (SDEP)
- ^ a b c d e Michael J. Radzicki and Robert A. Taylor (2008). "Origin of System Dynamics: Jay W. Forrester and the History of System Dynamics". In: U.S. Department of Energy's Introduction to System Dynamics. Retrieved 23 Oktober 2008.
- ^ Forrester, Jay (1971). Counterintuitive behavior of social systems. Technology Review 73(3): 52–68
- ^ Sterman, John D. (2000). Business Dynamics: Systems Thinking and Modeling for a Complex World. New York: McGraw
- ^ Meadows, Donella. (2008). Thinking in Systems: A Primer. Earthscan
- ^ Sterman, John D. (2001). "System dynamics modeling: Tools for learning in a complex world". California management review 43 (4): 8–25.
- ^ System Dynamics Society
- ^ Repenning, Nelson P. (2001). "Understanding fire fighting in new product development". The Journal of Product Innovation Management 18 (5): 285–300. doi:10.1016/S0737-6782(01)00099-6.
- ^ Nelson P. Repenning (1999). Resource dependence in product development improvement efforts, Massachusetts Institute of Technology Sloan School of Management Department of Operations Management/System Dynamics Group, dec 1999.
- ^ a b Michael J. Radzicki and Robert A. Taylor (2008). "Feedback". In: U.S. Department of Energy's Introduction to System Dynamics. Retrieved 23 October 2008.
[edit] Further reading
- Forrester, Jay W. (1961). Industrial Dynamics. Pegasus Communications. ISBN 1-883823-36-6.
- Forrester, Jay W. (1969). Urban Dynamics. Pegasus Communications. ISBN 1-883823-39-0.
- Meadows, Donella H. (1972). Limits to Growth. New York: University books. ISBN 0-87663-165-0.
- Morecroft, John (2007). Strategic Modelling and Business Dynamics: A Feedback Systems Approach. John Wiley & Sons. ISBN 0-470-01286-2.
- Roberts, Edward B. (1978). Managerial Applications of System Dynamics. Cambridge: MIT Press. ISBN 0-262-18088-X.
- Randers, Jorgen (1980). Elements of the System Dynamics Method. Cambridge: MIT Press. ISBN 0-915299-39-9.
- Senge, Peter (1990). The Fifth Discipline. Currency. ISBN 0-385-26095-4.
- Sterman, John D. (2000). Business Dynamics: Systems thinking and modeling for a complex world. McGraw Hill. ISBN 0-07-231135-5.
[edit] External links
| Wikimedia Commons has media related to: systems dynamics |
- Study Prepared for the U.S. Department of Energy's Introducing System Dynamics -
- Desert Island Dynamics "An Annotated Survey of the Essential System Dynamics Literature"
- Institute of Global Dynamic Systems, Canberra, Australia
- Ecotoxicology & Models
| ||
| ||


No comments:
Post a Comment