Co-written by Frank Ramsperger, Partner of Alpha Plus Advisors, LLC
March 16, 2009 Seeking Alpha
SUMMARY
No matter how complex, the underlying basis of almost every economic theory is that markets search for prices that create a balance between supply and demand. Consequently, when all participants act rationally, free markets and the economy are stable.
George Soros does not agree.
His theory of reflexivity suggests that, sometimes, markets are inherently unstable. The underlying forces create negative feedback loops that cause prices to diverge wildly from equilibrium. Reflexivity helps explain why this happens and is the philosophy that he uses to identify these unstable environments. When prices move to the extreme, he bets on a reversal. As evidenced by his investment track record, Mr. Soros has applied his theories with great success.
In this paper, we examine the ideas behind reflexivity and discuss how they result in parabolic price patterns. The belief that markets simply tend to overshoot in search for equilibrium is inadequate. When destabilizing forces take hold, businesses, industries and financial markets move along a relentless path away from equilibrium, sometimes creating a virtuous spiral of prosperity, and other times a vicious cycle of economic destruction.
We conclude that when the destabilizing forces that caused the current bear market and economic recession finally abate, the U.S. will not be confronted with a so-called L-shaped recovery. In contrast, based on examples from history, stock market reversals in similar environments were V-shaped over a one-year timeframe. We illustrate why the conditions are now ripe for such a reversal.
INTRODUCTION
After retiring from active money management in 2000, George Soros quietly started overseeing the assets of his hedge fund again in 2007. His initial run with the Quantum Fund in the early ‘70s generated 40+% annualized returns for more than a decade. In the bear market of 2008, he is reported to have again outperformed most investors by making a profit during the market decline. How does he do it? In a word, reflexivity.
Mr. Soros calls it his life’s work, and has written several books1,2 on the topic. Even so, he admits to receiving as much criticism as praise for his theories on the economy and financial markets. In a 1994 speech3, Soros attempted to explain his concept of reflexivity in the following statement,
“There is an active relationship between thinking and reality, as well as the passive one which is the only one recognized by natural science and, by way of false analogy, also by economic theory. I call the passive relationship the “cognitive function” and the active relationship the “participating function,” and the interaction between the two functions I call “reflexivity.”
Reflexivity is, in effect, a two-way feedback mechanism in which reality helps shape the participants’ thinking and the participants’ thinking helps shape reality in an unending process…”
Wow. Clearly his talents as a practitioner are superior to his ability to explain his ideas, and enlighten others. Our goal in this paper is to simplify and clarify. We will even be so bold as to draw some conclusions about the current market environment based on reflexivity.
click to enlarge
ANALYSIS
Are Markets Inherently Stable?
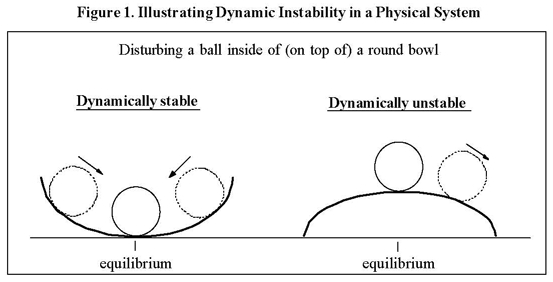
We start with an analogy from the physical world, then apply the idea to the financial arena. Imagine a small round marble sitting inside of a cereal bowl, as shown in Figure 1. If the marble is disturbed by the application of a lateral force it will roll around, and eventually return to the bottom of the bowl. This is a dynamically stable system. Now imaging the bowl turned upside down with the marble sitting on top. Disturbing the marble causes it to roll away and fall to the side, never again to return to its perch on top of the bowl. This is a dynamically unstable system as it does not tend to return to equilibrium.
Many economic theories assume markets are dynamically stable, or self-correcting. For example, when profit margins are excessive, new competition will drive down prices. Similarly, rational investors are supposed to allocate capital out of overvalued securities and into the most attractively priced shares causing individual stock valuations to move closer to levels supported by fundamentals. In general, supply and demand usually move towards an equilibrium that creates a market clearing price. However, reality does not always obey these over-simplified theories. Reflexivity suggests that, sometimes, markets are unstable… the marble rolls away.
Virtuous and Vicious Cycles
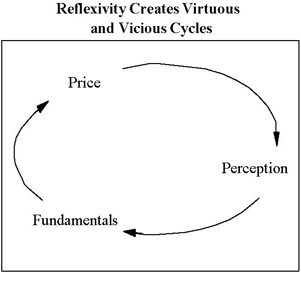
Consider the relationship between a company and its publicly traded stock under normal business conditions. It is intuitive that when the fundamentals improve the share price rises. However, does it make sense that a changing share price might, in turn, impact the fundamentals? Sometimes the answer is yes.
A simple and timely example is seen from the effect of credit ratings. When Moody’s or S&P downgrades the credit ratings of a given financial institution (think AIG), it can have an impact on the amount of collateral the company must pledge to back its obligations. A downgrade also increases the cost of capital for new debt issuances. The view of the S&P analyst is, in part, subjective. The perception of the company’s future prospects and current financial condition plays an important role in the assignment of the credit rating, and a falling stock price gives a bad impression. The negative feedback loop between capital requirements (fundamentals), stock price, and credit ratings (perception) causes a vicious cycle.
Negative feedback loops cause markets to become unstable in both directions, sometimes to the benefit of investors and sometimes to their detriment. For instance, during the housing bubble, rising home prices led to increased home equity which, in turn, encouraged banks to reduce lending standards, providing consumers with more capital to push up home prices even further, creating more home equity, and so on. This was a negative feedback loop that created a virtuous cycle.
In general, a reflexive relationship is characterized by negative feedback loops that cause dynamic disequilibrium in the interaction between fundamentals and price. Consequently, prices move to the extreme. Soros credits his investment success to reflexivity, which he uses to identify price extremes. He then bets on a sharp reversal.
Identifying the Extremes
Soros lays the theoretical groundwork, but his writings fail to answer the important question, “How far is too far?” The important link between theory and practice is the decision of precisely when to bet on the reversal.
Soros does not provide any clues about how he solves this problem. Timing is obviously a key to success since markets will be in freefall (or melt up) when the reflexive forces are in full swing, by definition. Picking tops and bottoms has the potential to cause substantial investor angst in the short run, even if the strategy eventually proves profitable.
Using the current bear market as an example, we accept the fact that fundamentals, and commentary from the media/analysts, will be abysmal at the bottom in stock prices. Indeed that is a key feature of reflexivity: lower prices cause deteriorating fundamentals, which leads to lower prices, and on and on. Investors are now focusing on the so-called second derivative of information flow looking for signs that the business environment is getting less bad. One message from reflexivity is that the focus should be on the fundamentals that are causing the negative feedback loop. Even so, fundamentals are usually of little help in anticipating the bottom in financial markets.
Stock prices have an annoying habit of turning higher ahead of many (or any) bullish news headlines. For this reason, we suggest the key to identifying extremes lies in the prices themselves. A study of historical stock market patterns during reflexive price movements can help us anticipate the turning point.
Parabolic Stock Patterns
Destabilized systems show up in many places. A hurricane, for example, starts off as an unorganized weather pattern that accelerates into a tightly formed funnel system. The key similarity for many unstable systems in science and nature is the pace at which the instability evolves – slowly at first, then faster and faster to the ultimate extreme. Destabilized markets follow the same pattern. Parabolic moves in equity prices during reflexive environments are consistent with the accelerating instability in the underlying fundamentals.
The origin of parabolic patterns is derived from the graph of a class of math equations called parabolas. As seen in Figure 2, a key feature of a parabola is its nonlinearity. The first unit of movement in the horizontal direction on the chart creates a one unit movement in the vertical direction. The second unit to the right traces out three additional units up. The chart is increasing at an accelerating rate.
Parabolic stocks also accelerate, and are characterized by ever steeper uptrend lines. Note how the pullback to point C in Figure 3 fails to reach the initial trend line, creating a steeper second trendline. Parabolic stock declines also exist. As shown in the bottom pane of Figure 3, the end of a fully developed parabolic move is characterized by a near vertical price pattern, which is a critical sign that the reversal is near.
Specifically, the best circumstances for anticipating a reversal are when,
- the parabolic move is fully developed (three or more successive trendlines);
- the stock price pattern is near vertical; and
- reflexive forces are apparent.
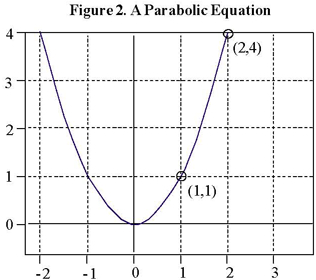

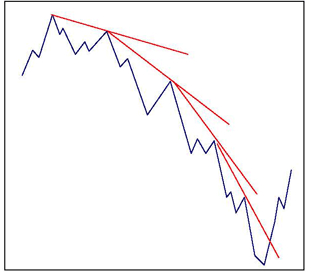
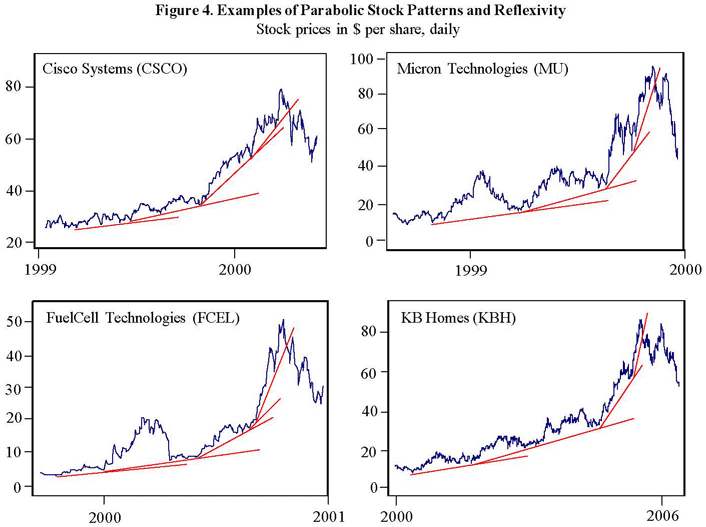
Figure 4 illustrates some historical examples. During the extremes of the technology bubble at the turn of the Millennium, many technology companies benefitted from rising stock prices. Cisco Systems (CSCO) was representative of the group and enjoyed a parabolic stock increase. One type of virtuous cycle in play then was the use of employee stock options. A rising stock price helped companies like Cisco attract talented employees with the lure of lucrative stock options. At the same time, compensation expense from stock options was not fully reflected in the income statement, adding a boost to earnings. A rising stock price improved company fundamentals... reflexivity.
Micron Technologies (MU) benefitted from the perception of a shortage in DRAM (memory chips used in PCs, laptops, etc). After the bubble burst, it was revealed that Micron’s customers had been ordering twice the amount of DRAM that they actually needed to ensure a steady supply.
Increasing order backlogs encouraged higher earnings estimates from Wall Street analysts, which led to a rising stock price, more fear of shortages, more double ordering, etc. The virtuous cycle was matched by a parabolic rise in the stock.
FuelCell Technologies (FCEL) illustrates how much price can drive perception. Here the hype was around the promise of hydrogen-based fuel cells as an alternative energy source. Eventually, the excitement led to a proposal by President Bush in his 2003 State of the Union speech that the government should allocate funding to the fuel cell industry.
KB Homes (KBH) is one of the largest US homebuilders. As was discussed earlier, a strong negative feedback loop caused an unsustainable increase in the homebuilding industry. The resulting parabolic stock increase is seen in the chart.

Vicious Cycles from Past Bear Markets
Common to all recessions are forces that cause dynamic disequilibrium between fundamentals and prices. Some of these are,
A. Jobs losses - declining consumer spending/confidence - contraction in businesses targeting consumers - more job losses due to business contraction, etc.
B. Credit crunches: Business and consumer balance sheets deteriorate - tighter lending standards and less credit available - business/consumer spending slowdown - worsening balance sheets, etc.
C. Stock market declines - reduced “wealth effect” - decline in consumer spending - business contraction - more stock market declines, etc.
D. Stock market declines - lower capital gains tax revenues - rising government deficits - decreasing investor sentiment - more stock market declines, etc.
Other destabilizing factors during recessions and bear markets include the activities of trend following investors; reduced capital spending; and the inability to use stock as currency for mergers & acquisitions.
The current crisis in the banking industry has revealed some unique types of dynamic instabilities that are essentially unprecedented. Consider how the combination of a bank’s falling stock price, and government intervention can damage perceptions about the health of the bank causing deposits to flee. In fact, the government’s temporary increase in FDIC deposit insurance from $100,000 to $250,000 was supposed to increase the confidence of depositors. However, it also served as a reminder to individuals and small businesses that deposits above $250,000 are at risk. The negative spiral caused a flight to safety that increased the demand for government bonds to the point where yields for Three-Month U.S. Treasury Bills were actually negative for a brief period. Here, the negative feedback loop is summarized as follows: falling stock price & government intervention - deteriorating image of financial institution - decline in fundamentals (i.e. fleeing deposits) - further decline in stock price, etc.
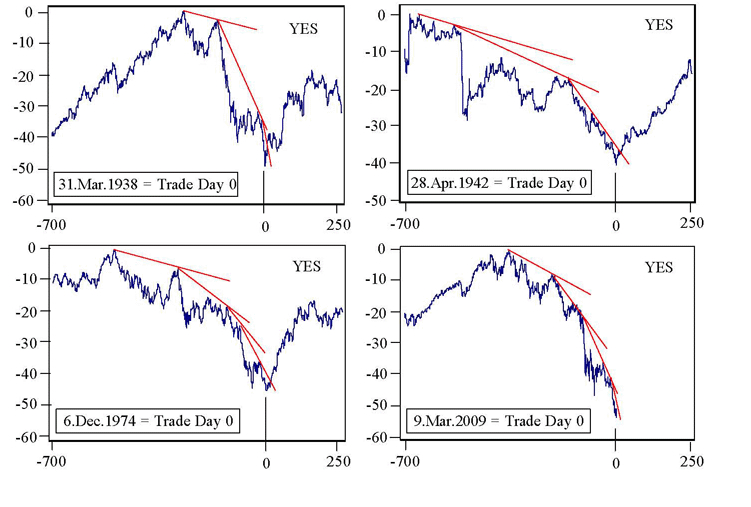
Figure 5 shows the eight worst bear markets in the history of the Dow Jones Industrial Average. Every decline was greater than 40% and was associated with an economic recession (or depression). In six of the eight cases, the index followed a parabolic pattern – an indication of accelerating destabilization. Furthermore, the bottoms occurred after a fully developed parabolic pattern was apparent and the index entered a near vertical descent.
Interestingly, the initial 48% decline in 1929 did not follow a normal parabolic pattern. After a sharp bear market rally the index continued to fall during the Great Depression and did not bottom until the drawdown surpassed 80% from peak to trough. The fact that this unprecedented bear market did not follow a parabolic pattern makes us wonder if the absence of reflexivity and the associated destabilizing economic forces can actually cause a recession to turn into a depression as the extreme washout in the economy never occurs. If true, it would be quite the paradox!
Today’s bear market, shown in the bottom pane of Figure 5, shows a particularly clear parabolic move. Using the weather analogy, if we were meteorologists impressed by the clear radar image of a fully-developed hurricane, we might view this market decline as the perfect storm since the parabola is so classically formed.
What Kind of Recovery?
One of the devious aspects of great bear markets is the variety of ways in which investors can be convinced to sell at the bottom. In today’s environment, the prospect of a dreaded L-shaped recovery is one reason to lose hope. However, the theory of reflexivity supports the outlook for a sharp reversal in both the economy and stock market. Indeed, a destabilized system is more likely to be poised for a violent recovery as the negative feedback loop dissipates. Refer again to Figure 5. In the six cases where a parabolic decline was apparent, the subsequent recovery after one year was between 35% and 60% - hardly an L-shaped recovery.
Fundamentals that move to an extreme are destined for sharp reversals. As an example, consider the current state of the auto industry. Annual vehicle sales are typically between 13-15 million units. According to recent reports, BMW, Ford (F), GM and Chrysler experienced sales declines ranging from -38% to -53% versus a year earlier. Auto sales are now running at a 9 million annualized rate, or a 4-6 million shortfall from normal levels. Additionally, reports of higher used car sales are widespread. Considering that there is a natural replacement cycle for vehicles as they have a limited lifespan, plus the incremental demand that come from U.S. population growth, both organically and due to immigration, the current situation is clearly creating an unsustainable level of pent-up demand for new cars.
CONCLUSION
We are at a unique time in history. The economy and financial markets have been driven by a variety of reflexive forces resulting in widespread destabilization. However, a fully developed parabolic stock market decline offers strong evidence that the extremes have been reached. Insights from George Soros’ theory of reflexivity, supported by examples from the past, lead us to conclude that the imminent reversal will be breathtaking. As we wrote this, the Dow had just surpassed 7,000 after testing 6,500. Indeed, the reversal might be at hand.
REFERENCES
1. The New Paradigm for Financial Markets: The Credit Crisis of 2008 and What it Means, by George Soros, Copyright 2008.
2. The Alchemy of Finance, by George Soros, Copyright 1987.
3. The MIT Department of Economics World Economy Laboratory Conference, Washington, D.C., April 26, 1994.
4. Dow Jones & CompanyDisclosure: I have no investments in any individual securities discussed in the article.
No comments:
Post a Comment